
Over the last 60+ years commercial nuclear power stations in the UK have produced a vast amount of energy that we readily consumed along with other similarly huge quantities generated by coal and gas fired plants. Now there are also the ‘green’ renewable sources such as tidal, solar and wind in the mix.
With central government and lobbying groups all vying for our attention along with honourable aspirations for an environmentally survivable future are there answers to the conundrums that pervade the energy landscape? With the rapid developments in technology and the popular will to defend our planet are we also ready to contribute to a greater plan by reducing our own consumption?
So in this article I want to provide some tools to navigate a way through these questions. Whilst this will not be particularly complex the arithmetic itself may be best tackled with a calculator.
Energy and Power - spot the difference
A useful starting point would be to consider what is the distinction between energy and power and the comparison between the various sources.
Our electricity usage is measured in kilowatt hours (kWh). This is the energy we’ve used. Power is the rating of a particular device or process. So a 100W bulb needs 100 watts of power to make it work. If we have leave this 100W light on for 10 hours the simplest of calculations looks like this:
100 Watts (power) X 10 hours (time) = 1,000Wh which, in turn, is equal to 1kWh
Another example is making a hot drink. I timed my 3kW rated kettle which took 3 minutes to boil. 3 minutes equates to 1/20 of an hour (3/60 in minutes) so the full calculation looks like this:
3kW (power) X 1/20 hours (time) = 0.15kWh, therefore 10 boils per day = 1.5kWh
At first glance it would appear these consumer based examples are fairly irrelevant as far as industrial scale electricity generation by power stations. However, when these examples are scaled up nationally it gives a sense of what the National Grid needs to be capable of addressing. Here are the quantities of measurement that are in use:
1,000 W (watts) = 1 kW (kilowatt)
1,000,000 W or 1,000 kW = 1 MW (megawatt)
1,000,000,000 W or 1,000,000 kW or 1,000 MW = 1GW (gigawatt)
1,000,000,000 kW or 1,000,000 MW or 1,000 GW = 1TW (terawatt)
Now we can compare the output for the UK’s power stations and microgeneration:
Type / Fuel
|
Name / Location
|
Maximum Output
|
Staffing
|
Coal / Biomass
|
Drax
|
3960MW
|
830
|
Nuclear
|
Sizewell B
|
1195MW
|
520
|
Wind Farm
|
London Array
|
630MW
|
90
|
Gas / CCGT
|
Enfield Power St
|
400MW
|
35
|
Solar Farm
|
Langenhoe
|
22MW
|
5
|
Domestic Solar
|
On the roof
|
0.004MW
|
0
|
Nuclear (closed)
|
Bradwell A
|
246MW
|
500
|
Nuclear (new?)
|
Bradwell B
|
2300MW
|
500-5,000
|
Nuclear (new?)
|
Hinkley Point C
|
3200MW
|
500-25,000
|
List (incomplete) of former and current electricity generating power stations:
UK Nuclear Power Stations Daily Statuses:
www.edfenergy.com/energy/power-station/daily-statuses
Energy Demand and Mix
Energy Demand and Mix
Since the 1920s the demand for energy gradually increased until 2006 and has started to fall ever since:
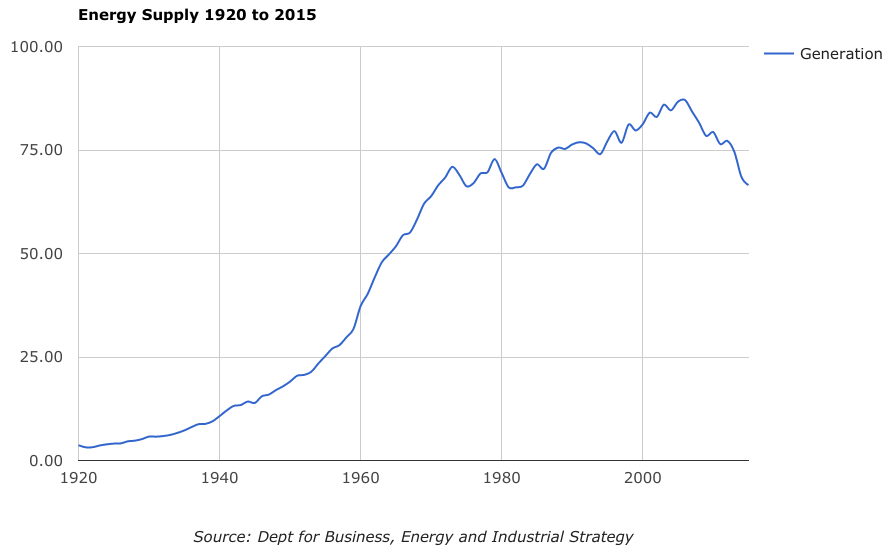
This is due to a number of factors including product efficiency, LED lighting, wind turbines, solar power and other renewables. The energy contribution from solar power, even in March, makes an identifiable dip in the daytime:
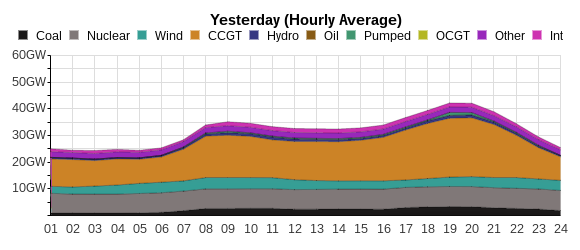
Source: gridwatch.co.uk
For a breakdown of sources here is a snapshot taken at 11:50 March 14th 2017: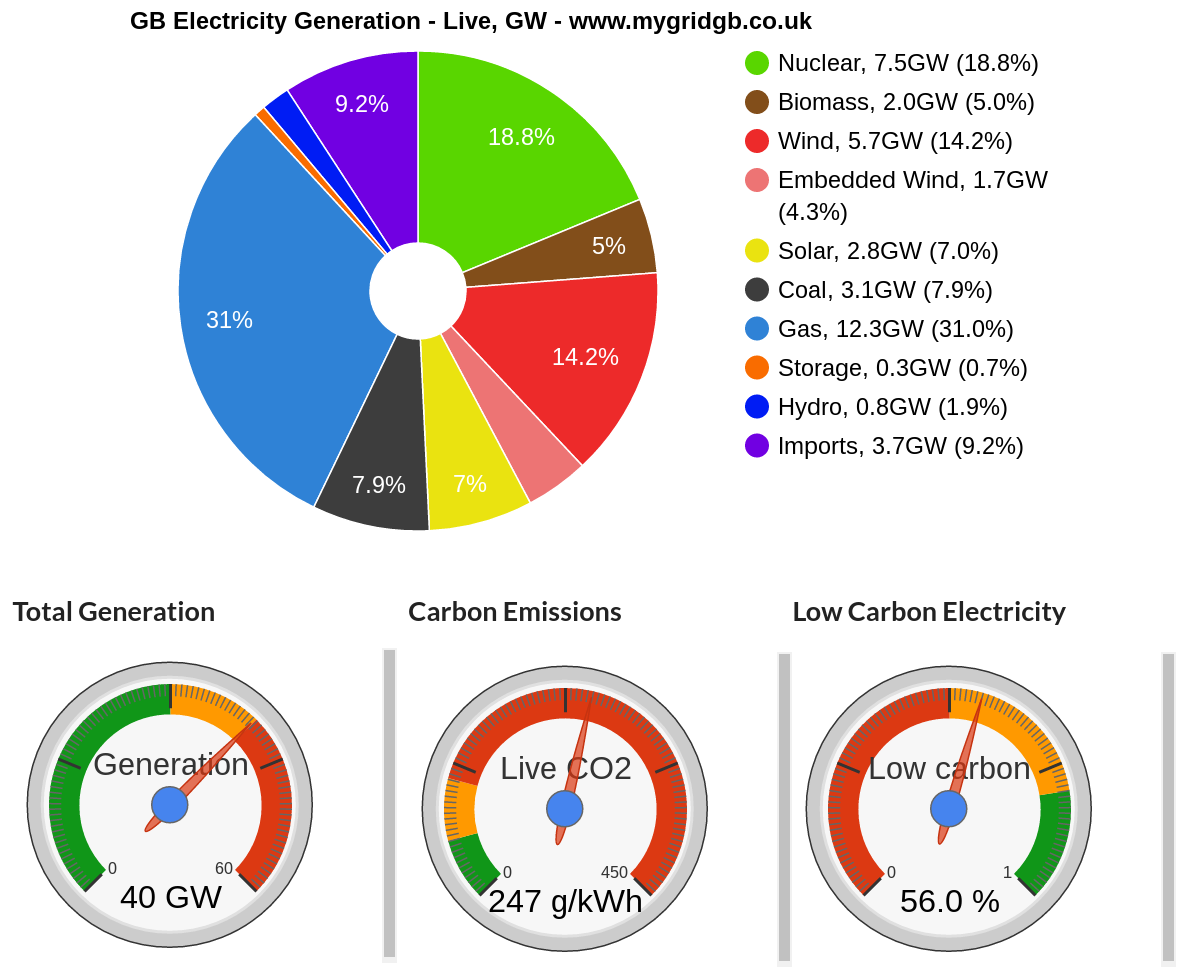
Source: www.mygridgb.co.uk
The proposed target for CO2 emissions is ~100g/kWh by 2030 yet the largest component of the Energy Mix is gas, a fossil fuel. Furthermore this is just the picture of Electricity generation, it does not include all the gas used for heating and industrial processes. During last summer (2016) coal was eliminated by the contribution of solar and wind, but on certain days during the winter months coal use was up to 17% and gas regularly around 50% during the daytime peak.
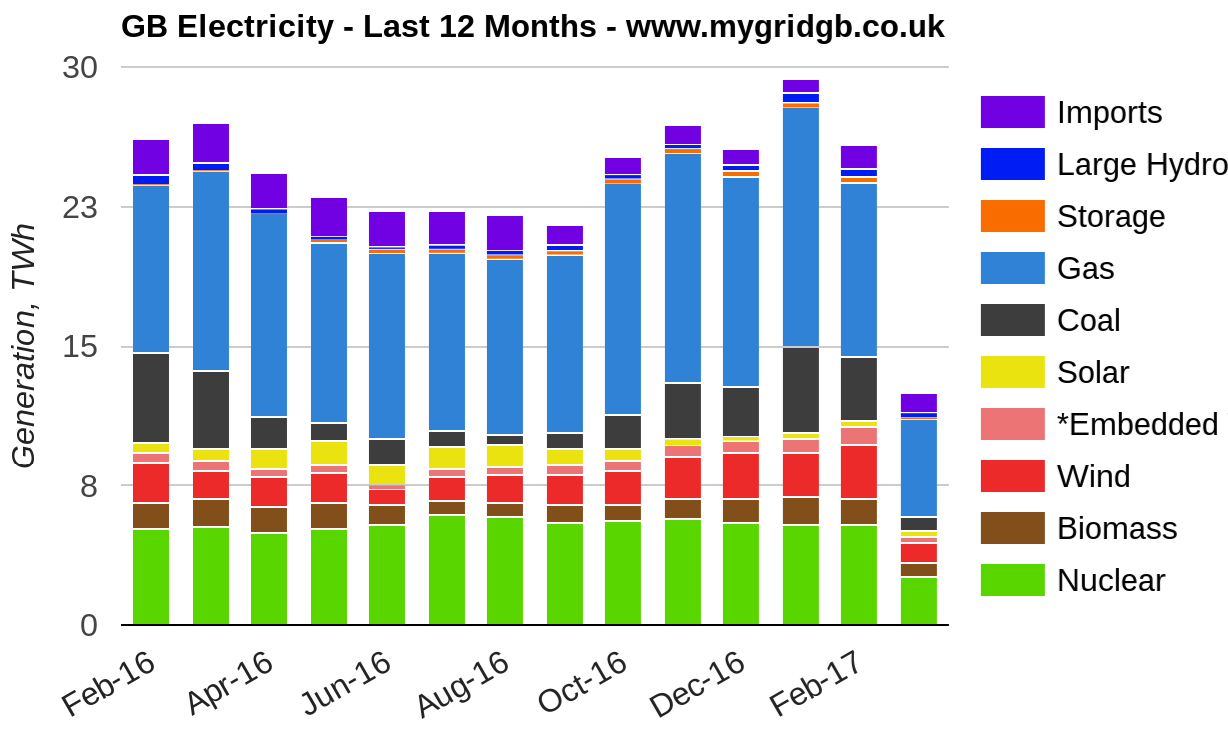
The relative contributions can be followed in this graph from data collected over the last 12 months. Whilst renewables very much part of the mix it is clear they cannot yet match current demand:
Challenge versus Compromise
So the question is how to fully address the two apparently conflicting issues of reducing Carbon whilst providing sufficient generation to matching demand?
Central government is hell bent on answering this apparent paradox by securing overseas investment in untried and experimental technology for massive nuclear power stations. Whilst in operation it is unarguable that the electricity produced would be low carbon, the lifetime CO2 is off the scale along with the price tag. It is established there is no long term solution for nuclear waste beyond temporary storage for 1000s of years.
Meanwhile the same government is claiming Fracking is environmentally friendly and the answer to the need for energy security in gas procurement. Concurrently the government’s investment in developing renewable technologies is derisory, even though viable projects, such as tidal lagoon generation, await the go ahead.
So let’s have a look at the two renewables that are very much in place.
Renewables - wind
Whilst wind and solar are variable and intermittent in the short term, they are surprisingly predictable over extended periods. However, as wind and solar are two of the most visible renewable systems, they come in for the most criticism.
Here is a capture from 1010uk.org/winddial taken on 14th March 2017. The live webpage includes the ability to scroll back and forth to compare output:
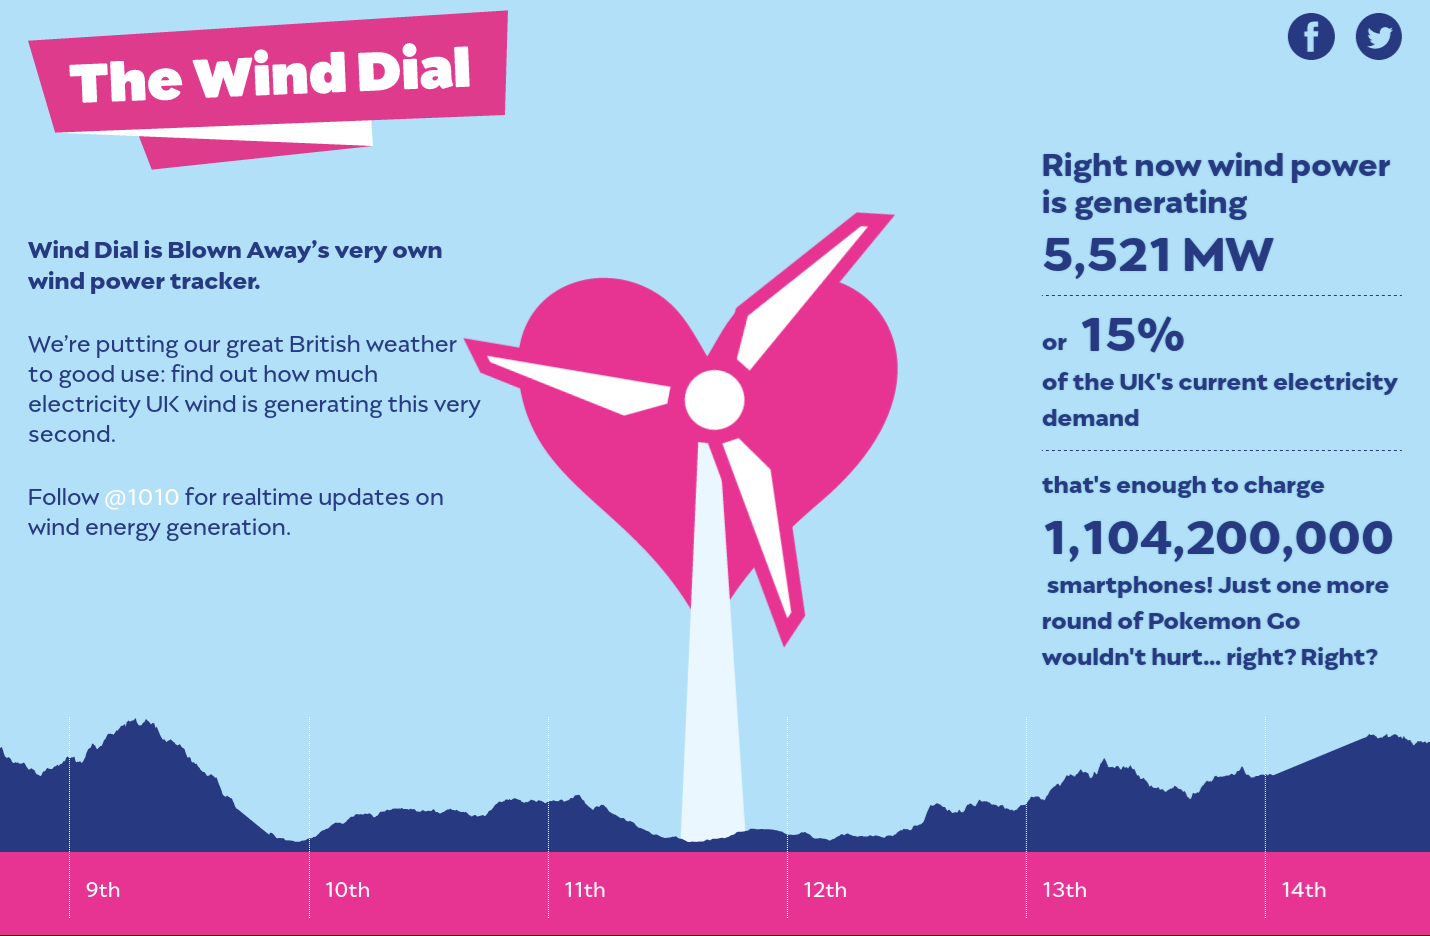
Source: 1010uk.org/winddial
Renewable - domestic solar
Being a bit of a statistics geek I have plotted the output from my roof based solar Photovoltaic (PV) 16 panel system. This graph compares the predicted output to the five year average of actual generation along with input from the National Grid:
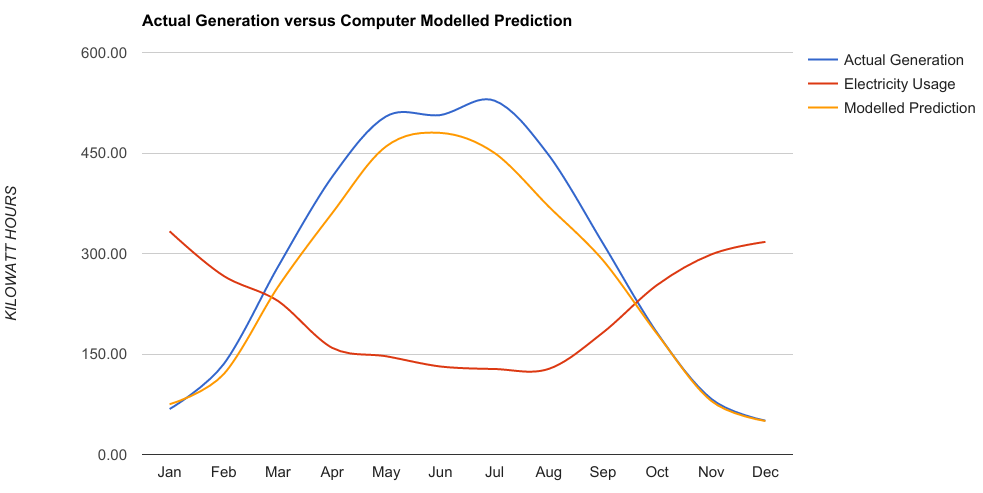
kWh/year
| ||
A
|
Typical Annual usage
|
3960
|
B
|
Usage for house with 16 panels Solar PV
|
2506
|
C
|
Electricity Saved (A-B)
|
1454
|
D
|
Solar PV Generation
|
3512
|
E
|
Returned to GRID (D-B)
|
1006
|
Therefore as my standard solar system produces 1MW per annum we could make an assumption that if every one of the 25 million homes in the UK had a similar solar array then that would yield 25TWh, 7% of the ~360TWh annual demand. However, around midday in the summer, allowing a conservative 2kWh output per roof, the generation would be 50GWh, more than matching demand.
This is idealistic, but the cost of carrying this out is 1/80th of Hinkley Point C!
Maximum Load and Load Factor
We use these units to compare different sources of power and then apply formula to estimate how much each is both capable of and what their expected output could be. These are then placed in this formula to determine the Load Factor:
Let’s start by taking a look at the Load Factor for Wind Turbines. Although the UK has 40% of Europe’s wind a criticism of Turbines is they only run a ⅓ of the year.
An offshore wind turbine (3mW) on the coast the calculation would look like:
There are 8760 hours in a year - 365 days x 24 hrs per day = 8760 hours per annum
The turbine on full output all year round is 8760 x 3mW = 26,280mWh or 26.28GW
It actually produces 30% (26.28GW X 30%) = 7.884GW (because of amount of wind)
7.884
Load factor ------- x 100 = 30%
26.28
The load factor only really compares efficiency rather than output, nevertheless it reveals another component to be considered in the electrical generation mix. Downtime for maintenance reduces the load factor considerably:
Load Factor of Nuclear, Coal and Gas ~50%
One of the least impressive load factors is of cars, which works out around just 2%.
Typical annual mileage 12000
-------- x 100 = 1.96%
8760 x 70 (mph) 613200
Forward Facing Formulae
Whilst carrying out some of the back of envelope arithmetic as in this article it is not easy to present an obvious and simple solution for a low carbon energy mix. During last year the overall consensus from the Energy Live 2016 conference exhibitors and presenters was about these three missions:
Energy reduction - use of LEDs, demand management (see below)...
Local generation - community projects and rooftop microgeneration…
Storage - from pumped storage to batteries including electric vehicles...
Energy Demand Management
For many of us growing up in the 50s and 60s and even later will remember power cuts. These were relatively frequent compared to today when they are apparently both rare and random, usually accompanied by extreme weather conditions. Furthermore the way electricity provision was managed was solely governed by the guaranteed, regular generation at any given time, referred to as ‘Base Load’. With the huge advances in software control the opposite approach is now taken to manage demand rather than capacity.
In addition, as battery storage becomes more financially viable, temporary storage of surplus electricity from wind and solar smooth can be utilised to smooth the peaks and troughs of demand. Large scale hydro pumped storage has been around for the last decade or so. Recently new projects have been given the green light to be constructed that essentially pump water to a higher reservoir when demand is lower than supply. Sophisticated software now can reduce the consumption of a larger hotel for a short period to supplement demand and provide payments back to the hotel, see more here:
Every weekday the National Grid face a critical supply 5 minutes, called a TV pickup, when millions of people switch on their kettles after the drums roll in the credits as Eastenders finishes. Typically this 3GW surge is controlled by a duty manager who actually watches the programme to best predict the optimum time to increase supply. This illustrates how vital and instant Energy Demand Management is at the very heart of the National Grid:
In conclusion...
This is an outline document to give perspective to the discussions around the foolishness, anachronism and fiscal recklessness of massive new nuclear projects in the UK. It doesn’t cover topics such as comparative Strike Prices and the role of capitalism in optimising profits for the benefits of shareholders rather than the customers. This latter point effectively reduces the safety margins, especially in huge price tag power stations such as Hinkley Point C.
Equally I hope this piece will encourage reasoned thinking to avoid making assumptions based on little or no mathematical evidence. I trust it has been helpful, you are welcome to respond, details below.
© 2017 - Peter Banks B.Sc.
Peter Banks is the Events Officer for the Colchester & District Green Party and will be standing in the forthcoming Essex County Council elections for the West Mersea & Tiptree district. He serves as a councillor on West Mersea Town Council and is on the Core Steering Committee of the Blackwater Against New Nuclear Group (BANNG).
Promoted by Robbie Spence on behalf of Peter Banks, both of 124 Morant Road, Colchester CO1 2JD

No comments:
Post a Comment